10: Everything You Need to Know about Technical Analysis (Financial Mathematics and Business)
Technical analysis is a trading methodology used to evaluate securities and financial markets based on statistical trends and market activity. Technical analysts examine past market data, including price and volume, to forecast future market behavior and make investment decisions. In this blog, we will explore the basic concepts and tools used in technical analysis.
The Basics:
Price charts
The cornerstone of technical analysis is the price chart. Technical analysts use charts to visualize historical prices and volume of a security over a specific period. These charts are available in various formats, including line charts, bar charts, and candlestick charts.
Line charts are the simplest type of chart, displaying the security's closing prices over a given period. Bar charts add more detail by showing the open, high, low, and close prices of the security in a given time frame. Candlestick charts, the most popular type of chart, show the same information as a bar chart but are easier to read.
Candlestick charts (green) represent an increase in price for the day, while red represents decrease. Depending on the colour, the upper wick will represent high for the day, the candle-body either close or open for the day, and the lower wick represents the low for the day.
:max_bytes(150000):strip_icc()/UnderstandingBasicCandlestickCharts-01_2-4d7b49098a0e4515bbb0b8f62cc85d77.png)
Trend lines
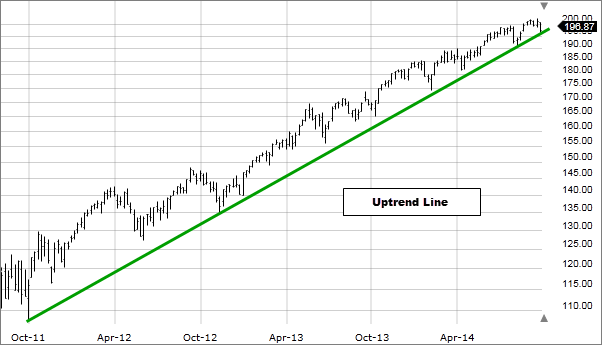
Trend lines are an essential tool in technical analysis, used to identify trends in a security's price. An uptrend line is drawn by connecting two or more low points, while a downtrend line is drawn by connecting two or more high points. Trend lines can help traders identify support and resistance levels, which are areas where the price tends to bounce off. The support is the point from which trends move upward, while charts tend to move downward from resistances.
Upward trends can be spotted when, in each part of a chart, the lowest point of that section is higher than the highest of the previous (and vice versa). Minor deviations don’t make much of a difference, but a major deviation may be sign of a change in trend.
Moving averages:
Moving averages are another popular tool used in technical analysis. They are calculated by averaging the security's closing price over a specified period, typically 20, 50 or 200 days. Moving averages can help traders identify trends and provide signals for buying and selling a security.
Basic Indicators:
Technical analysts use indicators to measure market activity and provide additional insight into a security's price movements. Some popular indicators include Relative Strength Index (RSI), Moving Average Convergence Divergence (MACD), and Bollinger Bands.
RSI measures the strength of a security's price action by comparing the magnitude of its recent gains to its recent losses. A reading above 70-80 indicates that the security is overbought, while a reading below 30-35 (typically) indicates that it is oversold.
MACD is a momentum indicator that measures the difference between two moving averages. Traders use MACD to identify trend reversals and generate buy and sell signals.
Bollinger Bands are a volatility indicator that shows the standard deviation of a security's price relative to its moving average. They are used to identify overbought and oversold conditions and provide a visual representation of a security's volatility.
(These are some basic ones, check out others - there are thousands - or even read up details on the ones mentioned here).
Something I’d have loved to talk about at this point is approaching the math behind technical derivative analysis. But most of viewers are in the younger age category and aren’t too interested in these. However, if requested by enough people, I’d be willing to write an article only on options and quantitative derivatives analysis (maybe you’ve heard of Black-Scholes, delta hedging, or put-call parity).
:max_bytes(150000):strip_icc()/dotdash_INV-final-Simple-Moving-Average-SMA-May-2021-01-98751e52a2d844a795d8d11434852d7c.jpg)
At this point, I intend to conclude this discussion.
Technical analysis is a powerful tool used by traders to analyze securities and financial markets. It provides valuable insights into market trends and helps traders make informed decisions about buying and selling securities. While technical analysis is not foolproof and often intuition just works better, it can be an effective way to manage risk and improve investment returns.
Something I’d like to note at this point is the fact that technical analysis typically isn’t that useful for long term investments since you’re essentially just looking at and qualitatively or quantitatively looking at trends. You’d probably want to use fundamental analysis for that. However, since fundamental analysis (though harder to apply) is easier to learn, I hope you’ll go ahead and look into that yourself (or maybe you already know it!)
If you are interested in understanding fundamental analysis, I recommend going to Yahoo Finance and checking out the ‘Financials’ section of essentially any company. Then, just search for the terms mentioned there (Investopedia is quite useful for this).
If you understand fundamentals and want to understand the math behind it:
https://groww.in/blog/essential-mathematics-investing
I’d like to also thank ‘The Trading Channel’ for their amazing resources on technical analysis. Do check them out!
Note: I am NOT giving financial advice. Any loss of money or bad investments due to inaccuracy in this article cannot be held against the blogger.
01001100 01101001 01110110 01100101 00100000 01001100 01101111 01101110 01100111 00100000 01100001 01101110 01100100 00100000 01010000 01110010 01101111 01110011 01110000 01100101 01110010 00100001 (No, your computer isn't hanging).


Comments
Post a Comment